
Odoo Web Graph Widget

Odoo Web Graph Widget
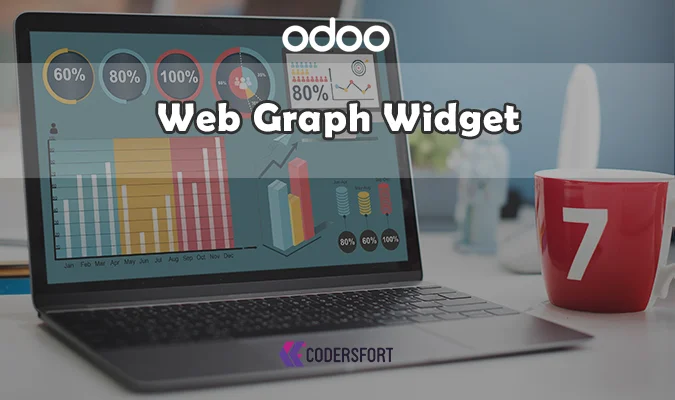
Odoo Web Graph Widget

What Is Odoo Web Graph Widget?

The Odoo Web Graph Widget is an advanced visualization module for Odoo that allows users to display beautiful and interactive charts directly inside form views. It helps teams turn raw numbers into clear visual insights without leaving the Odoo interface.

Why Interactive Graphs Matter

When data is displayed only in tables or raw values, it can be difficult to spot trends, comparisons, and performance gaps quickly. Interactive charts make information easier to scan, helping users understand what is happening in the business at a glance.

Why Your Business Needs Web Graph Widget

Limits of Traditional Data Display in Odoo

Standard Odoo form views are excellent for structured records, but they are not always ideal for communicating trends or performance over time. Users might need to open separate reports or export data just to see the bigger picture.

How Odoo Web Graph Widget Solves This

Odoo Web Graph Widget embeds charts directly inside form views, so key metrics can be visualized where the data lives. This reduces screen switching and turns everyday Odoo forms into lightweight dashboards that managers and users can rely on.

Key Features of Odoo Web Graph Widget

Interactive Chart Display Inside Form Views

The widget renders attractive charts directly inside Odoo form views. Users can inspect visual data while working with the underlying record, instead of jumping to separate reporting modules.

Native Form View Integration

Odoo Web Graph Widget is designed to plug into standard Odoo form views, making it easy to place graphs exactly where they add the most value. Charts appear alongside fields, notes, and attachments in a single, unified view.

Better Data Visualization for Non-Technical Users

By converting numbers into charts, the widget makes data more accessible for non-technical users. They can understand patterns and performance changes without needing to interpret complex tables or pivot views.

Clean and Modern UI

The widget presents charts with a clean, modern interface that fits naturally into Odoo. It enhances the visual quality of the form view while keeping the layout professional and easy to read.

Business-Friendly Reporting in Context

Instead of viewing reports in isolation, users see charts directly connected to the record they are managing. This contextual reporting makes it easier to explain results, track progress, and discuss performance with the team.

Benefits of Odoo Web Graph Widget

Faster Understanding of Data

Graphs communicate trends faster than tables. Users can understand growth, decline, and comparisons in a few seconds by looking at the chart embedded in the form view.

Better Decision-Making

Visual data helps managers and teams react faster to changing business conditions. The widget supports smarter planning and more informed decisions by making key metrics more visible.

Improved Odoo User Experience

By embedding charts directly into forms, the widget makes Odoo more intuitive and engaging to use. Users do not need to switch tabs or export data just to interpret what is going on.

Reduced Dependence on External Reporting Tools

Because charts are available inside Odoo, many quick insights can be obtained without exporting data to spreadsheets or BI tools. This reduces friction and keeps workflows inside the ERP.

More Effective Business Communication

Visual charts help teams explain performance and results more clearly during reviews, meetings, and management discussions. They make it easier to communicate numbers to stakeholders.

How Odoo Web Graph Widget Works

Install the Module

Install the Odoo Web Graph Widget module in your Odoo instance from CodersFort or your custom addons directory. Update the apps list so the widget becomes available for configuration in form views.

Configure the Widget in the Form View

Add the widget to the form view XML or configuration where chart visualization is needed. Point it to the relevant data source or field structure, so the chart can read the correct values.

Display Charts Directly Inside Forms

Once configured, open the form view and the chart will render inside the page. Users can see the graph alongside other record details and interact with the form as usual.

Use It in Daily Operations

Teams can inspect record data and view graphical representation at the same time. This keeps analysis connected to the business record and makes day-to-day operations more insight-driven.

Frequently Asked Questions

What does Odoo Web Graph Widget do?

It displays interactive charts directly inside Odoo form views, making business data easier to visualize and understand.

Can I use it inside standard Odoo forms?

Yes. The widget is designed to work inside Odoo form views, so charts appear in the right context without needing separate report screens.

Does it improve reporting?

Yes. It helps convert raw data into visual charts, improving readability and analysis for both technical and non-technical users.

Is it suitable for business dashboards?

Yes. You can use the widget wherever visual representation of data adds value, including embedded dashboards and analytical form views.

Does it replace normal Odoo reports?

No. It complements existing reports by giving users a more visual way to inspect data inside forms, while classic reports remain available when needed.

Is it useful for non-technical users?

Yes. Charts are easier to interpret than tables, so the widget helps non-technical users understand data without digging through complex reports.

Related CodersFort Modules

Odoo Multiple Files Upload Widget

Odoo Multiple Files Upload Widget helps users upload and manage multiple files directly inside Odoo forms, enhancing document workflows.

Odoo Multi Level List View

Odoo Multi Level List View turns flat list views into hierarchical tree structures, making it easier to navigate complex parent–child records.

Odoo Apps Store

Odoo Apps Store is the main CodersFort catalog of high-quality Odoo extensions and business modules designed to improve visibility, UX, and productivity.


Buy from our app store or contact us directly